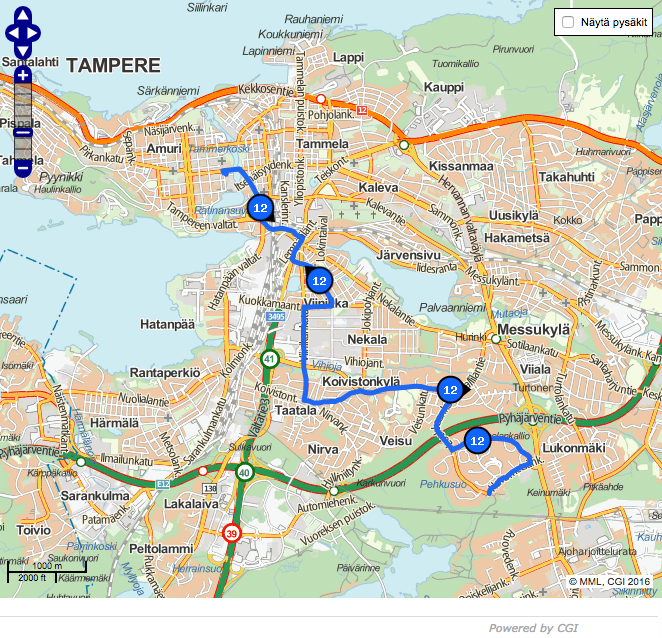
In this series of posts, I am going to make a case study on analyzing public transportation timetable accuracy in Tampere, Finland, where I live, using Apache Spark. All the buses in the town of Tampere are equipped with GPS and share their location. The travelers typically view them like this.
Also, I’m using local weather information provided by the Finnish Meteorological Institute.
My objectives for this case study are as follows:
- Calculate the journey time for specific bus routes and lines. I’ll be using Spark for this.
- Correlate the journey time with a few key parameters: the weekday, the hour of the day, whether it’s a working day or not, the temperature and the amount of rain. I’ll be using the R statistical analysis program for this.
Quick peek at the results
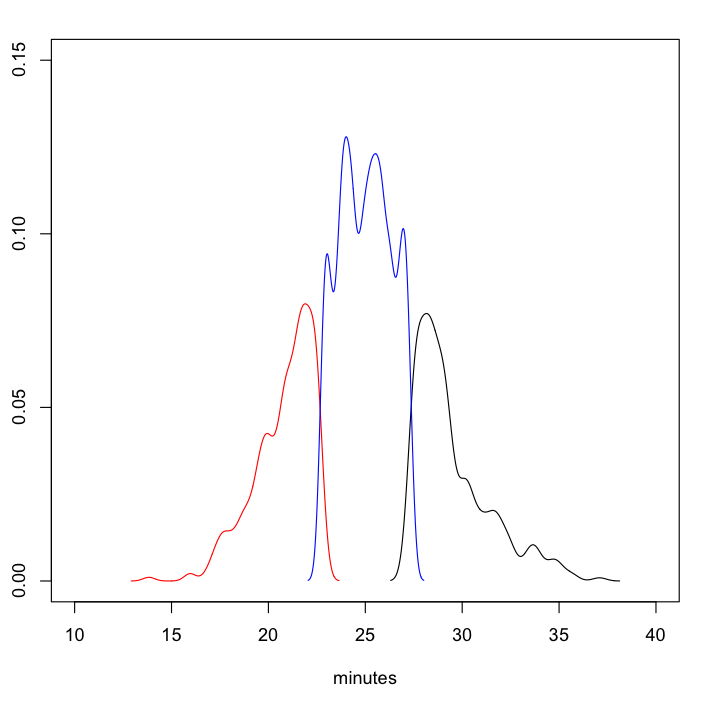
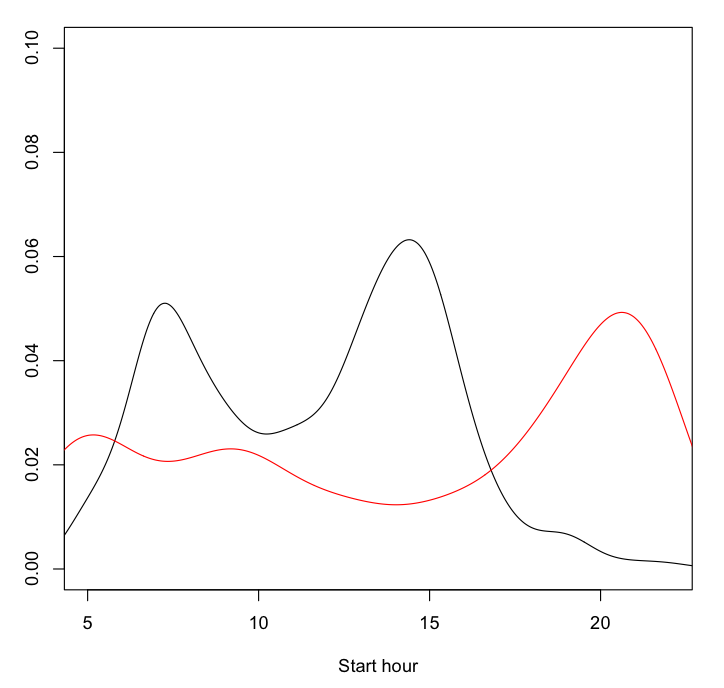
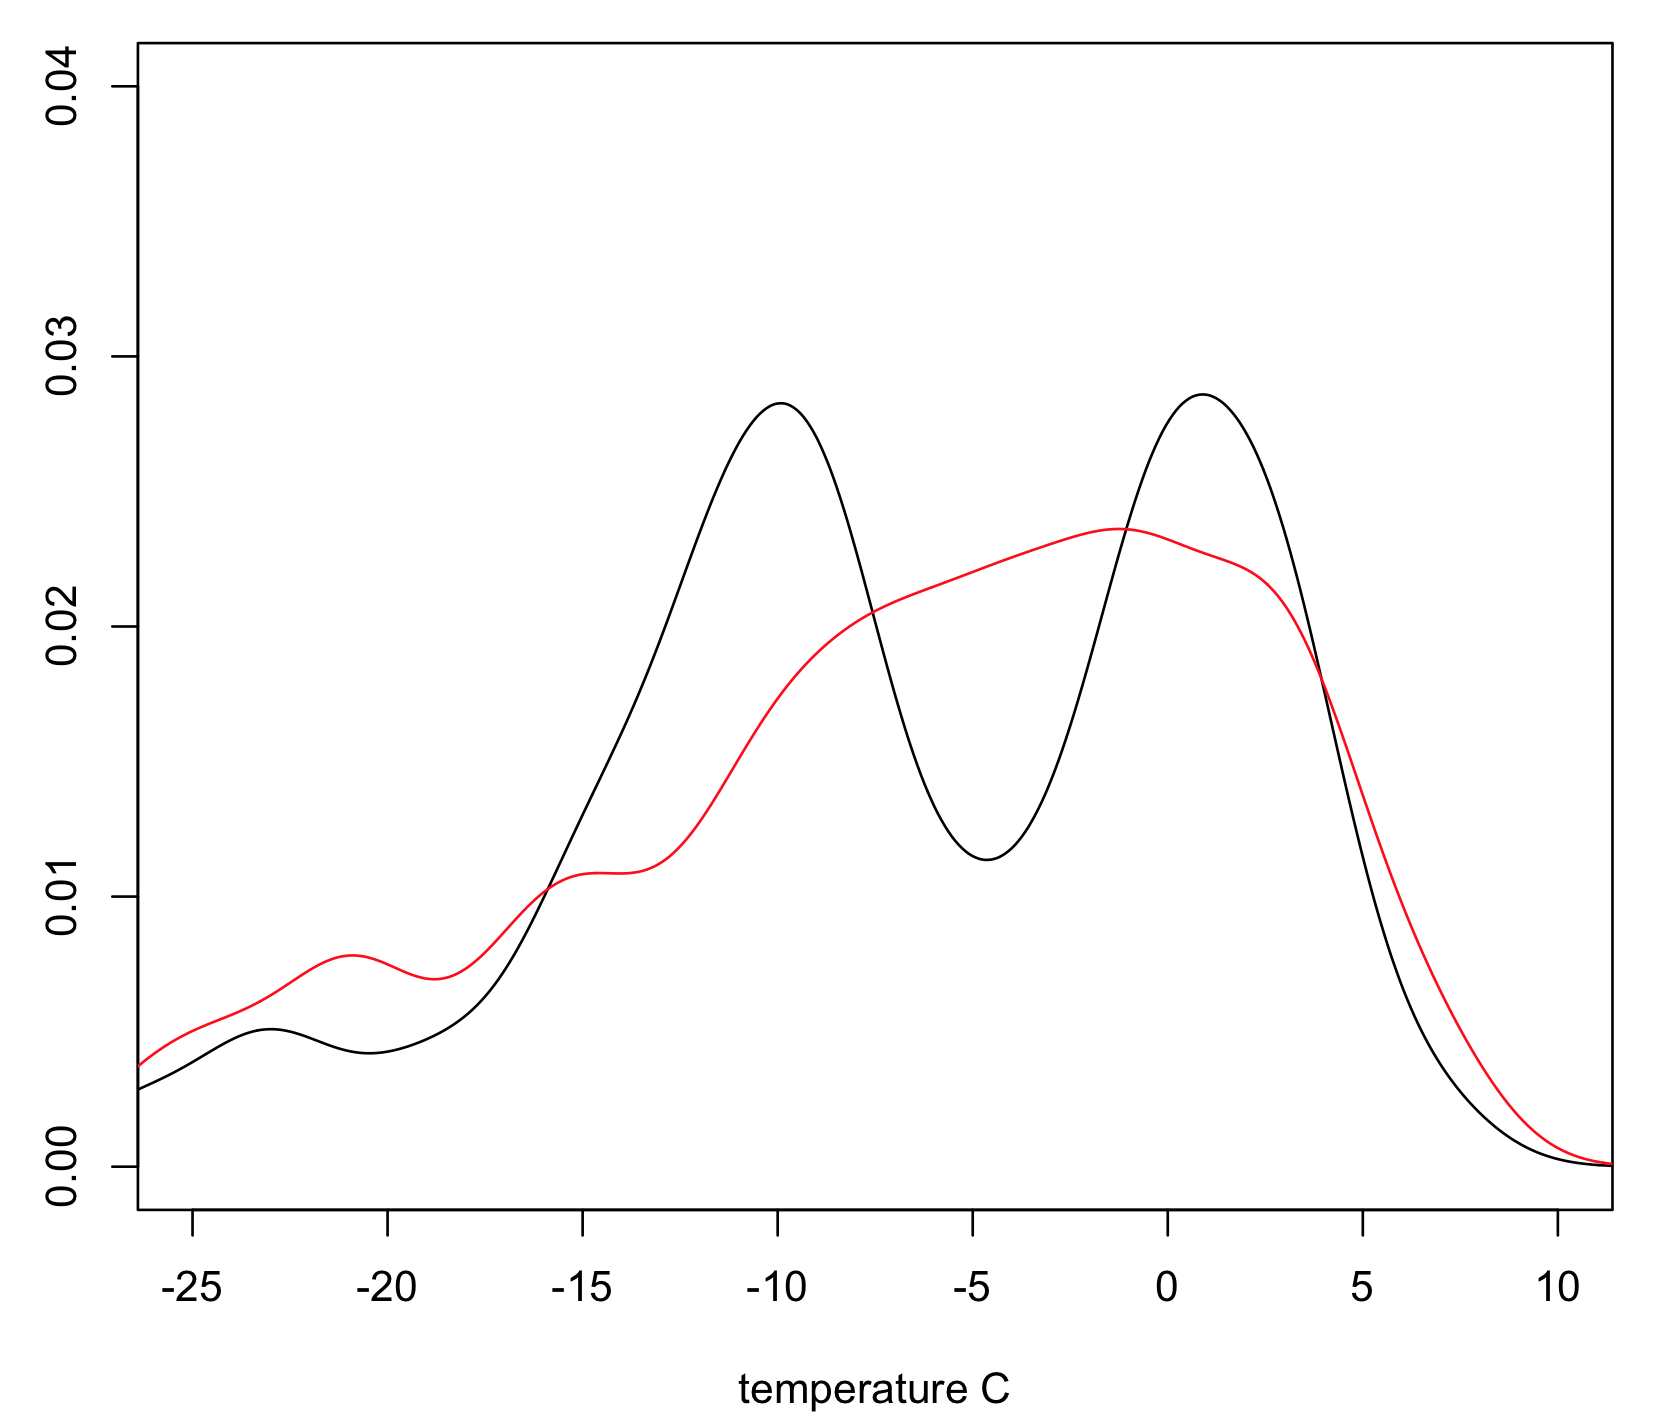
The following images present results of the analysis on a data set covering roughly one month. The first one shows the estimated probability density of the journey duration of the bus line 12 from Hallila, split into the bottom quantile (the fastest), the top quantile (the slowest) and the rest. The second diagram shows a plot of the estimated density functions for the scheduled start hour of the journeys in the quantiles corresponding to the fastest (in red color) and slowest journeys. The fairly obvious conclusion is that the ones starting at around the beginning and end of the workday are the slowest, whereas the evening and mid-day bus journeys are typically faster. The third diagram shows the distribution of temperatures for the same quantiles. Interestingly, the distribution of the journeys in the fastest quantile seems to be bi-modal. It’s a bit difficult to say without more data and a deeper analysis if this is a real finding or just an anomaly of my analysis. We’ll soon see what was done to get these results.
Big Data
Big data is a buzzword that can be used to sell expensive services or wrap old concepts in a new, sexier, package. At the same time, even after the hype has been stripped off, there is no denying the paradigm shift that has been creeping to almost all areas of data analysis with an inevitable force during the past decade. So how should big data be understood?
According to Wikipedia:
Big data is a broad term for data sets so large or complex that traditional data processing applications are inadequate.
Size and complexity can be very subjective and indeed the boundaries often depend on the situation. There have been some arguments against using big data tools, probably caused by over-enthusiasm by some and aggressive marketing by the vendors. The criticism often goes along the lines that “your data is not so big that it could not be processed on a fast PC, with a large hard drive using tool X and language Y”. One factor may also be the perceived excessive complexity and expense of using traditional big data tools, many of which have been inspired and even developed by the likes of Google, Yahoo, and Microsoft. Few use cases achieve quite the same scale. So when should one consider using big data tools? Here are a few reasons for doing so:
- There simply is too much data for the “one PC” approach. Since there are no feasible alternatives, this may be a no-brainer.
- Even though the above situation may not be the case in a today’s project, there is potential that this may change in the future. Investing time and effort into data analysis algorithm design and implementation is unwise if there is no clear path for scalability for future needs.
- Data is stored in the cloud. Even though traditional data analysis tools can be run in the cloud, most cloud service providers offer big data tools without the complexity and cost of owning and administering the hardware.
- Data is unstructured. Many databases excel at storing and processing unstructured data, but this is still an area where big data tools excel. Scalability (of the analysis stage) and a more flexible programming model are the key differentiators, but sometimes they come at the expense of additional complexity.
- Data needs to be secured. Backing up large data sets is a big pain. Distributed file systems and databases offer a compelling solution for storing data with redundancy.
Choosing the big data tool
Having decided that using the big data approach is a viable option in my case, I needed to choose from the vast array of tools available to prospective data scientists and engineers. Apache Hadoop is probably the best known of the open source big data projects. It includes modules such as the HDFS distributed file system, the YARN resource negotiator, and the MapReduce parallel processing framework. Well-known related projects are the Cassandra and HBase databases. Hadoop MapReduce is one of the best known big data processing engines. However, it can be slow, and its programming model is often seen as cumbersome and restrictive. Typically, a truly massive amount of data needs to be available for processing to justify using MapReduce. Apache Spark is a very popular and modern engine for processing big data. It provides a nimbler alternative to MapReduce that is more flexible to program and it is often much faster. One great thing about Spark is that it belongs to the Hadoop ecosystem and enjoys the same benefits and interoperability with other Hadoop-compatible tools.
Spark summarized
According to the Spark website,
Apache Spark™ is a fast and general engine for large-scale data processing.
Here is a summary of the key benefits of Spark:
- Speed. Spark is optimized for in-memory parallel processing.
- Scalability. Spark runs everywhere. Spark runs fine on a laptop, but scales, with relative ease, to large clusters, and to the cloud. All the major cloud providers (e.g., Amazon, Google, Microsoft Azure, IBM) support Spark as a service.
- Part of the established Hadoop ecosystem.
- Flexible, functional programming model. Spark programs can be written in Scala (Spark’s native language), Python and Java. Simple Spark programs are literally like simple command line utility scripts.
- Generality. Spark can be used to combine SQL, streaming, and complex analytics.
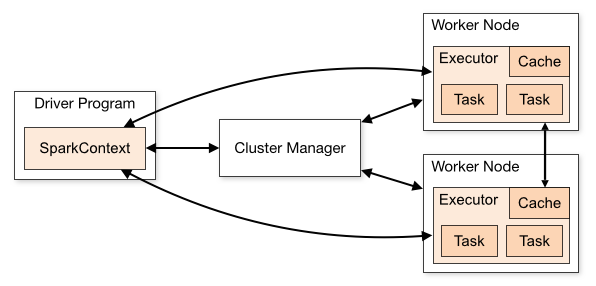
A Spark applications running on a cluster consists of a driver program and multiple task executors running on worker nodes. A cluster manager (Spark includes one or can use an external manager, such as Hadoop YARN) is responsible for resource allocation across the cluster. On the one hand, this can be completely transparent to the application programmer, which “lowers the bar”, but on the other hand, understanding the execution model is critical for writing high-performance parallel applications.
Spark also comes with a REPL called Spark shell. It’s a great tool for experimentation, but I won’t be covering it in this series.
Spark key concepts
- Driver program. The driver is responsible for loading the Spark Context, which provides utility functions for data I/O. The driver contains a main function and gets its parameters via command line arguments.
- Resilient Distributed Datasets (RDDs). An RDD is an immutable fault-tolerant collection of elements that can be operated on in parallel. RDDs can be created either from existing in-memory collections or by loading data from an external source such as the local file system, Hadoop HDFS, Amazon S3, or from any of the most popular databases. Each RDD is split into multiple partitions that can be distributed to the cluster for computation.
- Transformations are operations (map, flatMap, reduce, fold, ..) on RDDs that create other RDDs. Transformations are lazily evaluated, meaning that the evaluation takes places only when an action is performed on an RDD.
- Actions compute the result from the RDDs and the transformations on them, and either return the result to the driver or save it to the file system, database, etc.
- RDD persistence. If a transformation is reused by different actions, it should be persisted (in-memory, file system, or their combination). Otherwise, it will be re-calculated for each action that refers to it.
- Shuffle operations trigger redistributing data across the Spark cluster. Shuffles can be very expensive as they involve I/O, serialization and network operations, but they are often necessary.
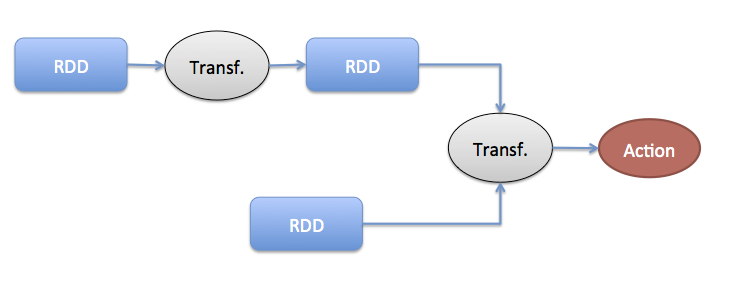
RDDs are transformed (map, filter, etc.) to other RDDs. They can be joined, too. Finally, actions (persist etc.) trigger the actual computation of results across the cluster.
Spark programmers can benefit from several extensions. Here are a few examples:
- SparkSQL provides a programming abstraction called DataFrames and can also act as distributed SQL query engine. Spark SQL can also be used to read data from an existing Hadoop Hive installation.
- MLib machine learning library provides statistical, classification, clustering, etc., tools that can be used on Spark DataFrames.
- SparkR — R on Spark. SparkR is an R package that provides a light-weight front-end to use Apache Spark from R.
In the second post of the series, I will show how Spark is installed and create a simple test application.