My previous post expanded the sample application to perform data extraction with Spark. I also showed how to load the result to R and perform a simple analysis. Next, I will run the application on a local cluster and then in the Amazon cloud using AWS Elastic MapReduce.
Spark standalone mode (local cluster)
It is extremely easy to run a Spark application on a local cluster. Spark’s standalone mode requires that Spark has been installed on each node in the cluster. We will run the whole “cluster” on a single computer. A Spark cluster consists of a master and multiple worker nodes.
A standalone master is started by running the start-up script provided in the Spark release:
$SPARKBIN/../sbin/start-master.shSpark provides a very useful graphical UI, by default at http://localhost:8080. The address of the master node can be seen at the top.
A worker node is started by executing the following command on the worker using the Spark URL.
$SPARKBIN/../sbin/start-slave.sh spark://Juhas-MBPr.local:7077Now that a minimal test cluster is running go back to the web UI and observe the new worker.
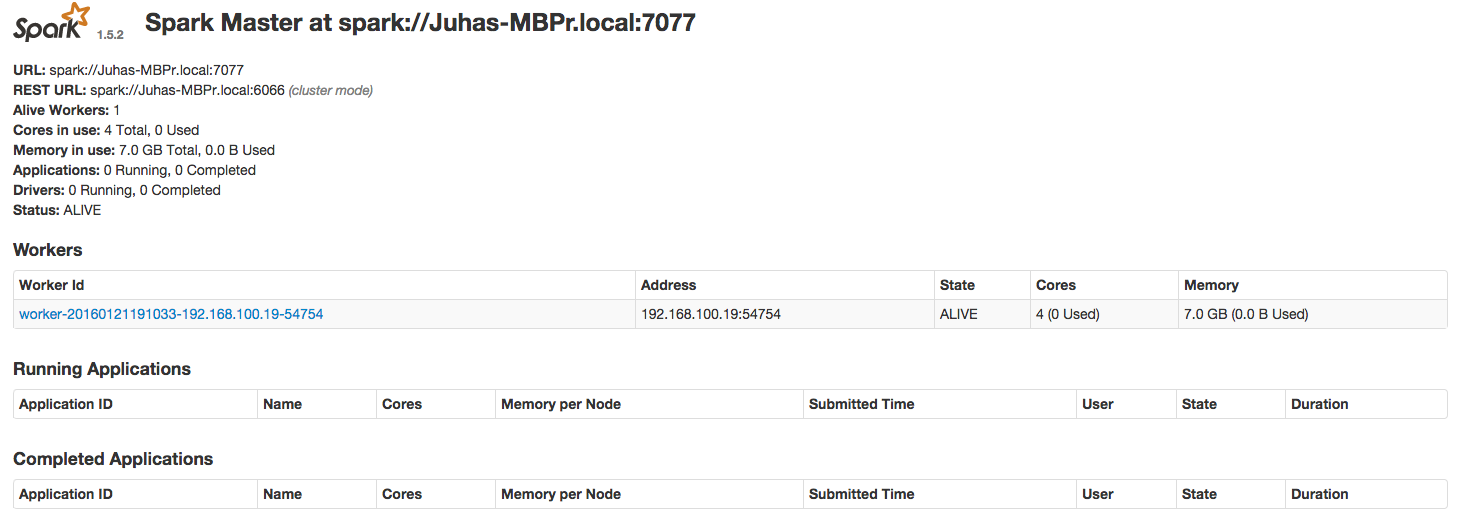
Cluster master's web UI
Revised sample project with more data
Let’s first check out a revised version of the sample project, and also the submodule with the new data (Note: around 50MB of data will be downloaded).
git checkout cluster
git submodule init
There is now a new directory BusDataSample with much more sample data that now covers one day (December 31, 2015).
The script submitjob.sh has also been changed to use this data. It also includes the --master spark://Juhas-MBPr.local:7077
option, which instructs Spark to run the job on the cluster. Spark’s web UI can once again be used for investigating
the cluster executing operations on the worker node.
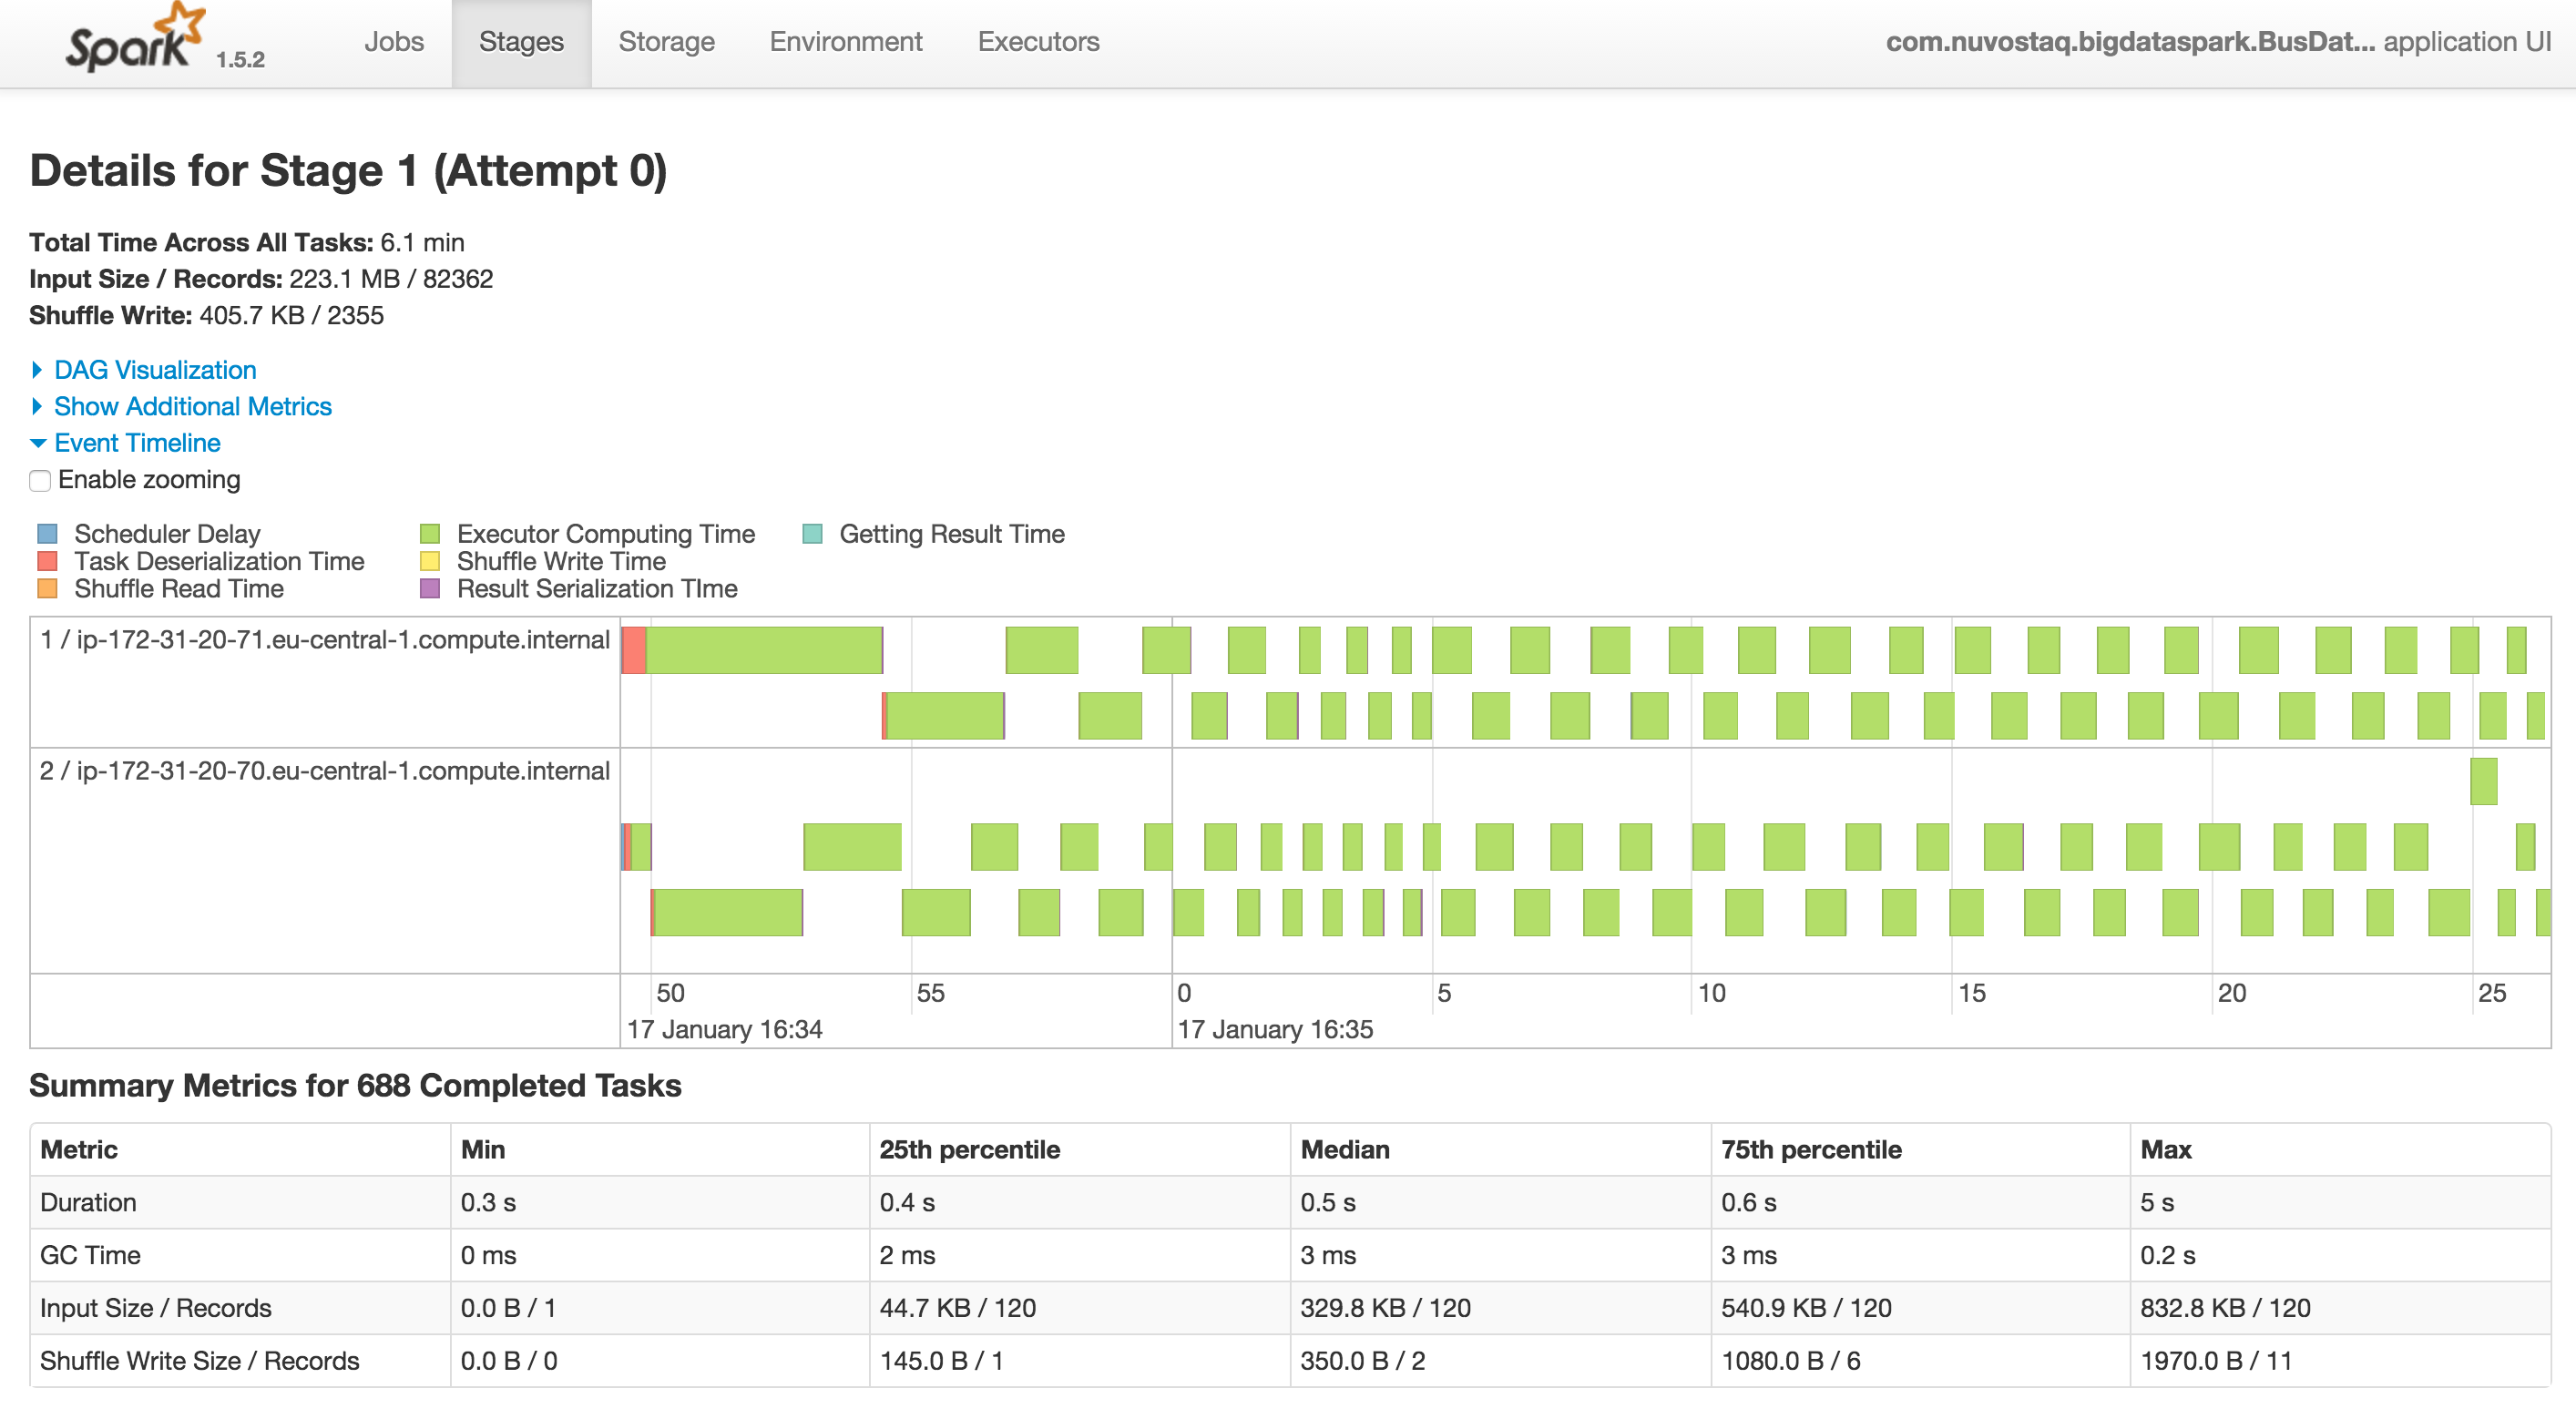
Graphical view of a processing stage in the Spark web UI
Eventually, the job will complete and write the results to the usual place as specified in the submitjob script. Next, we will continue our analysis in R.
Analysis with R
Spark writes its results on a per partition basis, which means there can be a large number of files. A single csv-file is created by concatenating the results with
cat /tmp/sparkout.endpweather/part-00* > /tmp/sparkout.csvNext, start up the R environment and open r-src/bus_analysis.R. The beginning of the file contains
some functions, but the following lines do what we need right now.
# Analysis of the data collected on December 31, 2015
route=util.load("/tmp/sparkout.csv", 12, "Hallila")
tr=util.topQuantile(route)
br=util.bottomQuantile(route)
# Plot 1
util.compareStart(tr,br)
# Plot 2
route$durMinutes=route$duration/60
pairs(~durMinutes+scheduledStartHour, route)
Plot 1 shows the estimated probability density function for the slowest and fastest (red) journeys during one day.
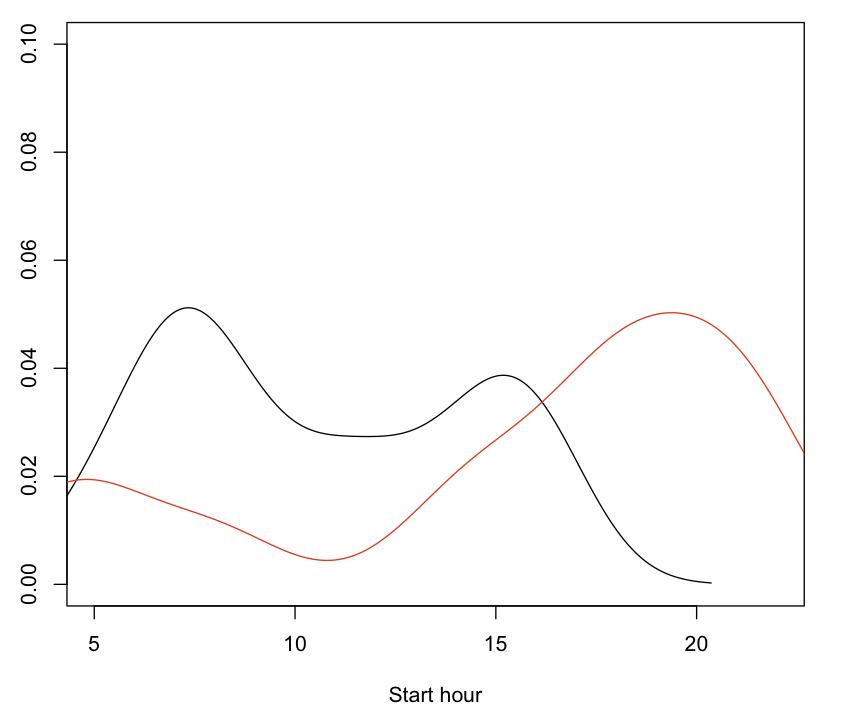
Plot 1: Bus trip duration vs. hour-of-the-day as a distribution for the fast (red) and slow trips.
Plot 2 two shows a different view of the same data.
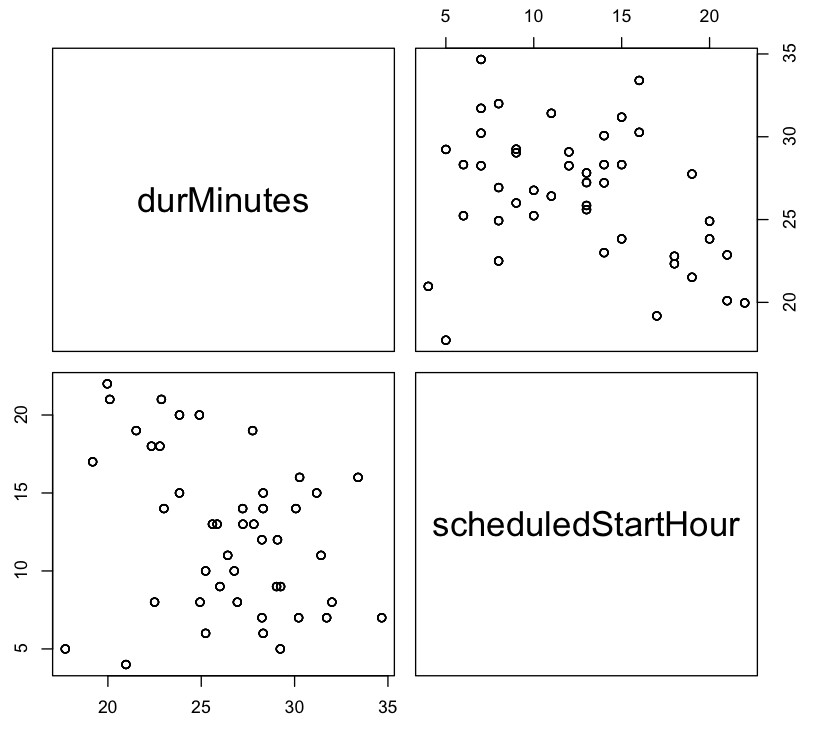
Plot 2: Bus trip duration vs. hour-of-the-day
Spark on Amazon
Amazon Web Services Elastic MapReduce (EMR) provides a very convenient and scalable solution for running Spark, which is also relatively economical. In order to do anything, an Amazon account is required with a valid credit card. See Amazon’s instructions.
Having created and account, we are ready to go. Amazon EMR provides a web UI and scripts for creating on-demand clusters and running Spark jobs on the cluster. Amazon’s Simple Storage Service (S3) is a secure, durable, highly scalable object storage that works seamlessly with EMR. A typical usage pattern is
- Collecting data and storing it to S3
- Running Spark jobs on EMR to analyze the data
- The results are written back to S3 for further analysis
Creating a cluster using the web UI is straightforward, but there are a few points worth noting.
- c3.xlarge instances are the cheapest, and work fine unless large amounts of memory are needed
- Amazon pricing can be a bit complex. Spark jobs are charged based on the usage of AWS instances and EMR jobs. Charges are calculated based on instance hours (see the billing FAQ) for full hours, so a 10-minute job costs as much as a one-hour job.
- The familiar web UI is available by using a browser extension. Just follow the instructions on the EMR job monitoring page.
- I find enabling YARN logging useful for debugging my Spark programs.
The logs can be accessed by ssh’ing to the cluster master and running
yarn logs -applicationId <application ID>with the application ID obtained from the logs in the web UI.
The following figures present a glimpse of the web UI and the way to configure YARN.
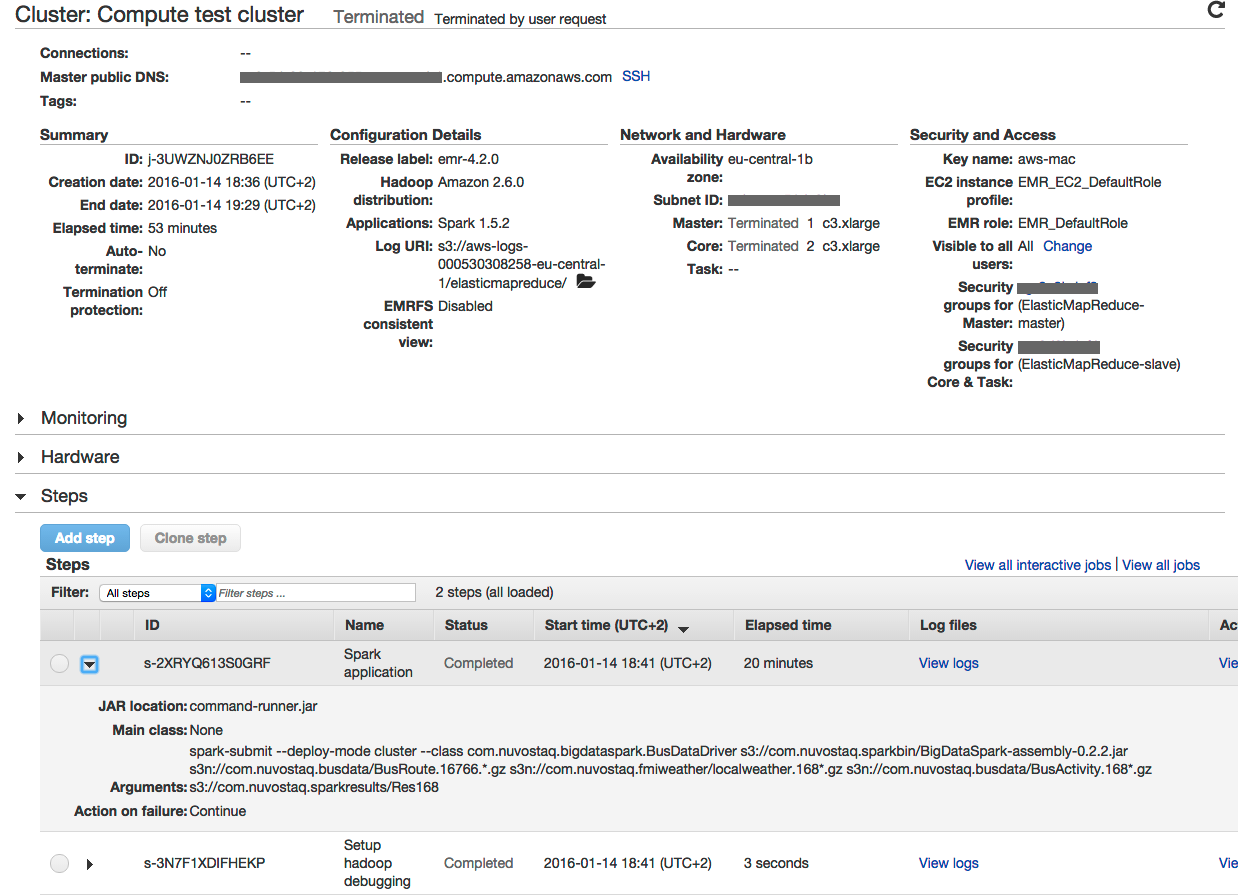
Amazon EMR test cluster
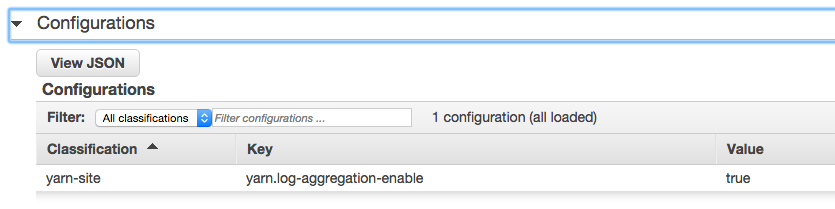
Enabling YARN log aggregation
Conclusions
This concludes my series, at least for now. I find Spark to be a modern and efficient parallel processing framework, which scales from small-scale experimentation to true big data problems. I did not get far with my bus timetable analysis, so maybe I’ll return to the problem once more data has been accumulated. Thanks for reading, hopefully, this has been useful!